
$6 a Day: The Reality of Food Stamps in the Bay Area
A Wake-Up Call
The record-long government shutdown has ended, but it brought CalFresh—California's food stamp program (SNAP)—into sharp focus for Bay Area residents. The uncertainty of those weeks highlighted just how many neighbors depend on this assistance to feed themselves and their families.
Nearly 680,000 Bay Area residents—9% of the population—rely on food stamps.
Among them are children who need breakfast before school, seniors on fixed incomes, and working families struggling with the Bay Area's cost of living.
The shutdown raised important questions that persist even as benefits resume: who receives CalFresh, how much do they get, and what are they buying with it?
_______________
CalFresh Eligibility
To qualify for CalFresh, households must have income below 200% of the federal poverty level. For a family of three, that's $3,660 per month or $43,920 annually. For a single person, it's $2,266 per month.
In the Bay Area, this includes a variety of situations:
A single parent working full-time at $20 per hour makes $3,467 per month before taxes—below the threshold for a family of two or three.
A senior on Social Security receiving the average benefit of $1,827 per month falls below the income limit.
Two full-time workers earning $15 per hour each bring home $5,200 per month combined, which qualifies a household of four or more.
While income determines eligibility, the Bay Area's high cost of living—where rent alone can consume $2,000-3,000 monthly—explains why working families need food assistance despite earning above minimum wage.
_______________
CalFresh in the Bay Area: The Numbers
The scope of food insecurity in this prosperous region is substantial:
Approximately 680,377 people in the Bay Area—9% of the population—receive food stamps.
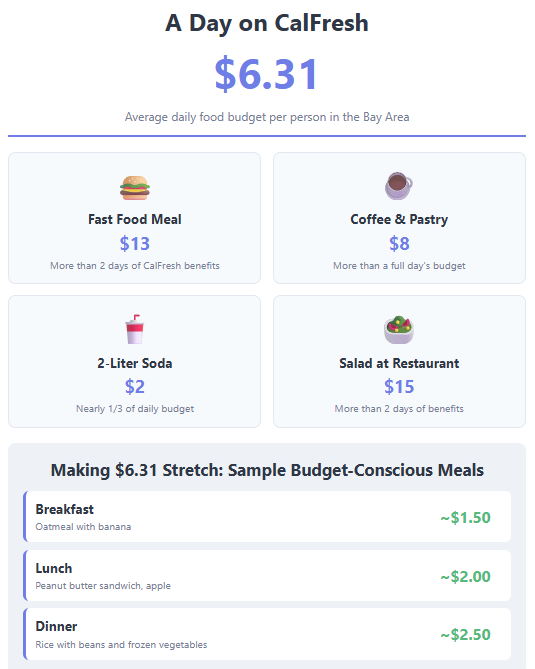
The average benefit is just $192 per person per month, or $2,304 per year. In a region where a single fast food meal averages $13, this breaks down to about $6.31 per day per person.
Who receives these benefits?
29% are children under 18
29% are seniors over 60
The remaining 42% are working-age adults; survey data from the SF-Marin Food Bank indicates that around 70% of their clients are working, and 35% are working multiple jobs
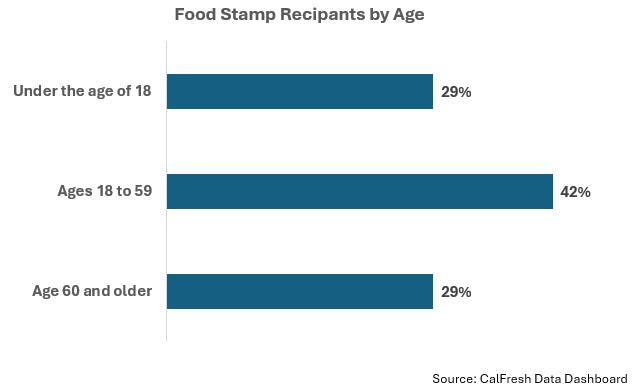
Nearly 60% are children and seniors—some of the community's most vulnerable populations.
The geography of need varies across the region:
Counties with the highest percentage of residents on CalFresh:
San Francisco: 13%
Solano: 12%
Alameda: 11%
Counties with the lowest percentage:
Marin: 5%
San Mateo: 6%
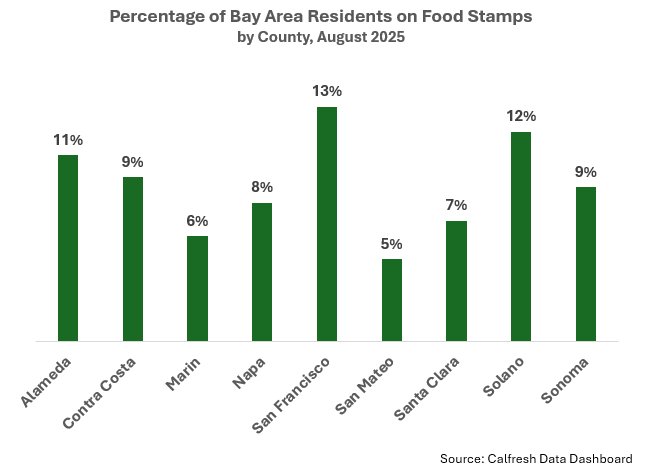
The disparities across counties are significant. More than one in eight San Franciscans depend on food assistance, compared to just one in twenty Marin residents.
_______________
Where Does the Money Go?
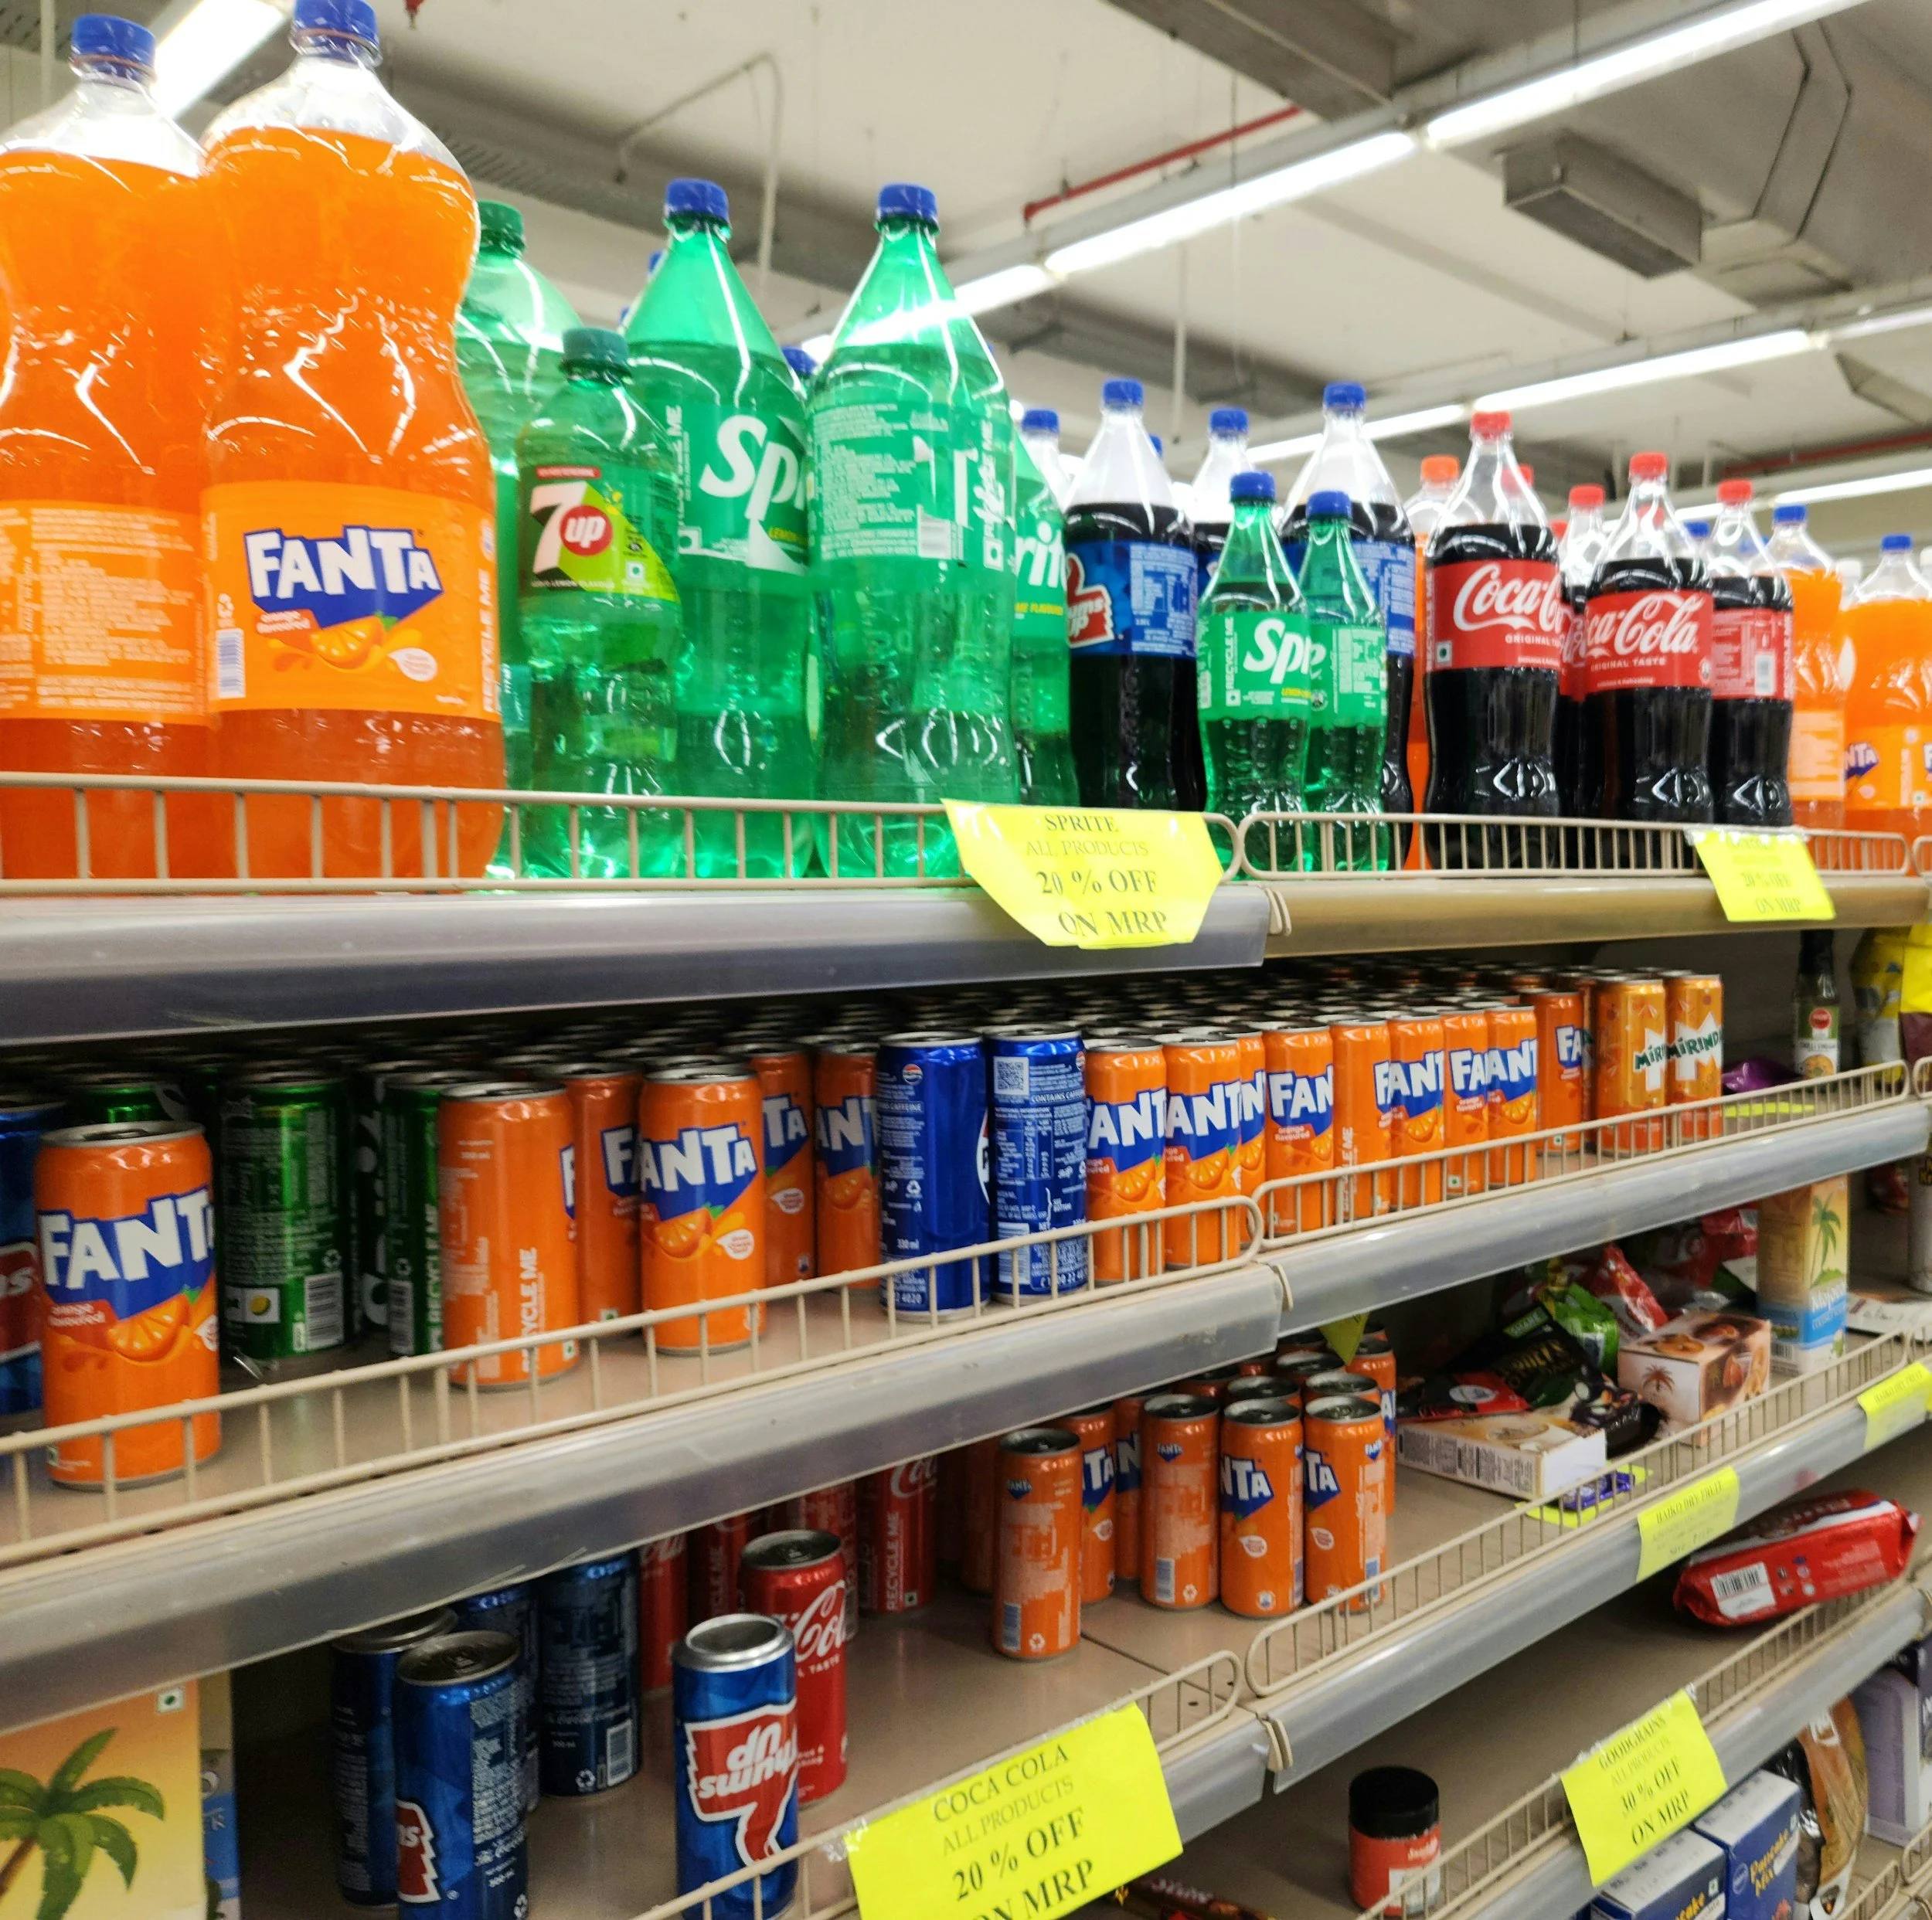
One persistent question in Calfresh policy debates is what recipients purchase with their benefits. Some argue benefits shouldn't cover unhealthy food like soda and candy. Others say such restrictions are paternalistic and stigmatizing.
A comprehensive 2016 USDA study compared actual point-of-sale purchases from SNAP and non-SNAP households nationwide. The findings reveal striking similarities across income levels.
_______________
The Surprising Reality
SNAP households and non-SNAP households buy remarkably similar foods. The data shows:
Both groups spend approximately 40% on staples: meat, vegetables, fruits, milk, eggs, and bread
Both spend about 20% on less nutritious items: sweetened beverages, desserts, salty snacks, and candy
The remaining 40% goes to various other foods like cereal, prepared foods, and dairy products
The top 10 food categories purchased are largely the same between SNAP and non-SNAP households—just ranked in slightly different orders. SNAP households spend slightly more on meat/seafood, sweetened beverages, and prepared foods, while non-SNAP households spend slightly more on vegetables and fruits.
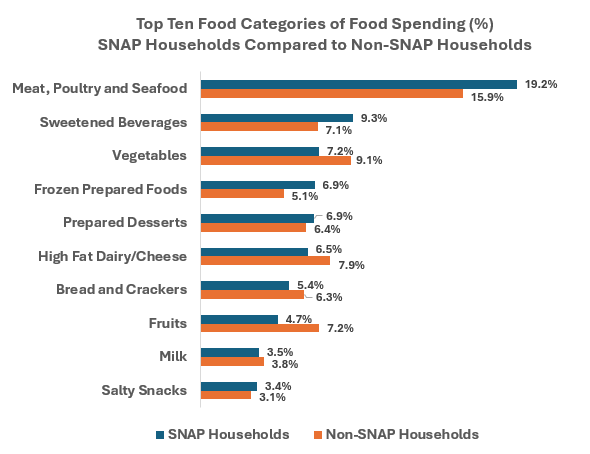
Imperfect nutritional choices are being made by all households, not solely by those participating in SNAP.
_______________
Context Matters
When judging low-income households’ purchasing decisions, context is important:
Budget constraints: At $6.31 per day per person in the Bay Area, every dollar counts. A 2-liter bottle of soda at $2 looks different when stretching benefits to last the month.
Food environment: Many low-income neighborhoods lack quality grocery stores. Corner stores with limited fresh produce may be the only accessible option.
Time poverty: Many CalFresh recipients work multiple jobs, and many are single parents, making quick, shelf-stable foods practical necessities.
_______________
Supporting Our Neighbors
Nearly 680,000 Bay Area residents—9% of the population—rely on CalFresh to put food on the table. The data tells a story about who they are: children, seniors on fixed incomes, working families struggling to afford both rent and groceries in one of the most expensive regions in the country. On average, they have $6.31 per day per person to spend on food—less than the cost of a coffee and pastry.
The data also reveals that SNAP households and non-SNAP households make remarkably similar purchasing decisions. The difference isn't so much what people buy—it's how much money they have to buy it with. The real nutritional challenges stem from American food culture itself, where processed, sugar-laden products are cheaper, more accessible, and taste good—making them appealing, calorie-dense choices regardless of income level.
For those who want to make a direct impact, Bay Area food banks have become increasingly focused on providing fresh, healthy food to people facing food insecurity. Organizations making a difference include:
These organizations work to increase access to healthy food, offering fresh produce and support services alongside emergency food assistance.