
Pay to Play: Youth Sports Cost Bay Area Families $5,610+
October 26, 2025
This is an update to our piece on the financial burden of youth sports from September, 2024.
Youth sports offer many benefits to children, including physical fitness, teamwork skills, character development, and social and emotional wellbeing.
However, participation comes at a steep cost: a child's primary sport alone typically consumes 2–3% of a family's annual income, if not more.
This analysis explores the financial impact of youth sports on families, with a focus on the San Francisco Bay Area.
Methodology
Using survey data from The Aspen Institute and cost of living data from the Economic Policy Institute (EPI), we have estimated the costs of youth sports for San Francisco Bay Area families.
____________
SF Bay Area Costs
Youth sports costs have surged 22% since 2022, and Bay Area families bear an even heavier burden. The average cost per main sport per child in the Bay Area is $1,901, 87% higher than the national average.
An additional sport costs an average of $904 per child. For a Bay Area family with two children playing two sports each, the average annual cost is $5,610.
____________
Income Disparities in Sports Spending
The amount spent per sport varies significantly based on family income level.
Bay Area families with annual incomes less than $50,000 spend an average of $1,129 per year on a child's primary sport. In contrast, the wealthiest families—those with annual incomes exceeding $100,000—spend an average of $2,974 per year. This more than 2.5-times difference in spending highlights the substantial disparity in resources allocated to youth sports across income brackets.
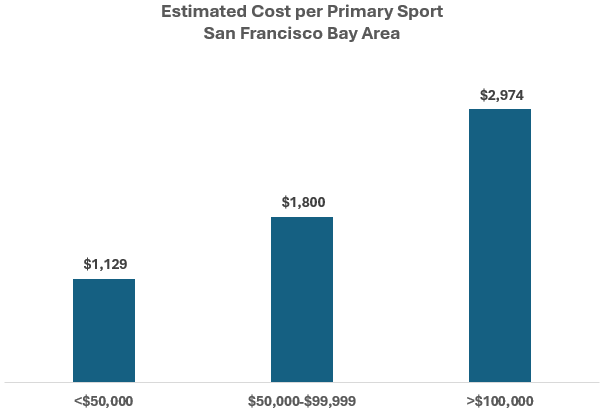
Source: The Aspen Institute; adjusted for local cost of living by Data for a Difference
A breakdown of annual spending by category for a child’s primary sport reveals that travel costs are the largest expense for sports families across all income levels, followed by registration and fees, and then lessons and private coaching. Notably, as income levels increase, families' spending on all aspects of youth sports also rises.
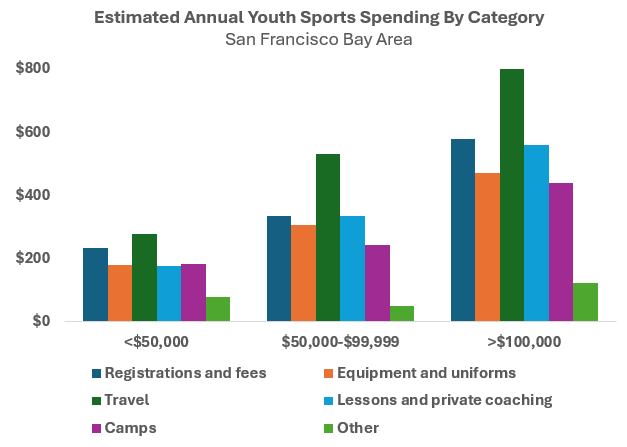
The Aspen Institute; adjusted for local cost of living by Data for a Difference
The Investment Mindset: Optimism vs. Reality
One of the key drivers behind parents' willingness to invest heavily in youth sports is their optimistic expectations about their child's athletic future. According to The Aspen Institute's survey, 22.2% of parents believe their child can play Division I college sports, and 11.4% believe their child is capable of playing professionally. These aspirations are particularly pronounced among parents of children who play tackle football and basketball.
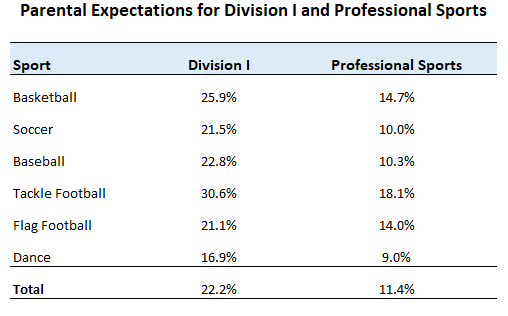
Source: The Aspen Institute
However, these expectations are sharply disconnected from reality. The actual odds of a high school athlete playing Division I sports are less than 2%, and the chances of reaching professional levels are less than 0.1%. This significant gap suggests that many families may be overinvesting in youth sports based on unrealistic projections—a mindset that drives parents to absorb escalating costs, further inflating prices across the industry.
____________
Participation Barriers
While some families stretch their budgets chasing athletic dreams, rising costs are pricing others out entirely. According to the National Survey of Children's Health, participation rates among California children have been declining, with only 33.9% of children from families living below the poverty line engaging in any sports activity. In contrast, children in families is the highest income group participate at a rate of 64.9%.
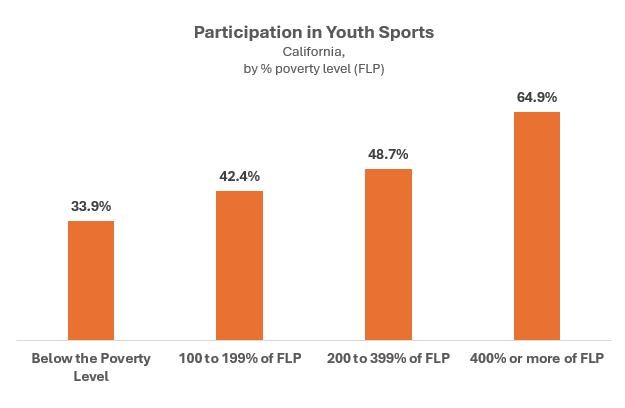
Source: National Survey of Children’s Health
This is particularly concerning given that nearly two-thirds of Bay Area children are not getting the CDC-recommended 60 minutes of physical activity per day. As costs continue to rise, it is essential to explore solutions that make sports more accessible and affordable for all families, regardless of income level.
____________
Conclusion
The data paints a clear picture: youth sports have become a significant financial burden and are increasingly cost-prohibitive, particularly for low-income families. While parental optimism about athletic scholarships and professional careers may justify these expenses in some minds, the stark reality is that fewer than 2% of high school athletes will play at the Division I level.
Bridging this gap requires both cultural change in how we view youth sports and creative solutions to lower costs and broaden participation. Some Bay Area organizations are working toward these goals. For example, the Olympic Club Foundation provides grants to nonprofits offering sports programming to low-income youth across the region, Youth on Course enables young people to play golf for $5 or less at over 2,000 courses worldwide, and Community Youth Center in Concord provides accessible athletic programs regardless of economic means. These efforts demonstrate that expanding access is possible with community commitment and innovative approaches.
____________