
Under Pressure: Deportation Trends and Enforcement Reality - Part 2

Following our Part 1 analysis of the landscape of undocumented immigrants in the SF Bay Area, this second installment examines the enforcement reality these communities now face. With nearly 500,000 undocumented immigrants in the Bay Area—and likely significantly more given the challenges of accurately counting this population—the recent increases in enforcement under the Trump Administration have generated widespread questions and anxiety about what comes next.
This is particularly acute in California, where the state has welcomed undocumented immigrants for many years in direct conflict with federal immigration policies, allowing them to build family, community, and career connections.
With border crossings down 84% this year, federal resources have shifted to interior enforcement, intensifying this longstanding conflict between state sanctuary policies and federal immigration law.
To understand what's happening on the ground, this week we focus on detention trends, arrest patterns, and the vulnerabilities facing these immigrant communities. Understanding deportation dynamics is complex, and we'll break down the key patterns and what they mean for the Bay Area's substantial undocumented population.
Key Findings: What the Data Shows
To understand current enforcement trends, we analyze detention and arrest data from the Transactional Records Access Clearinghouse (TRAC) that provides insights into what is happening on the ground.
1. Detention Numbers: Steady but Shifted
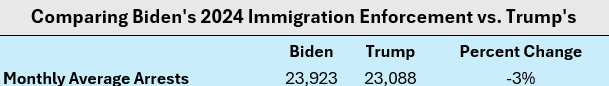
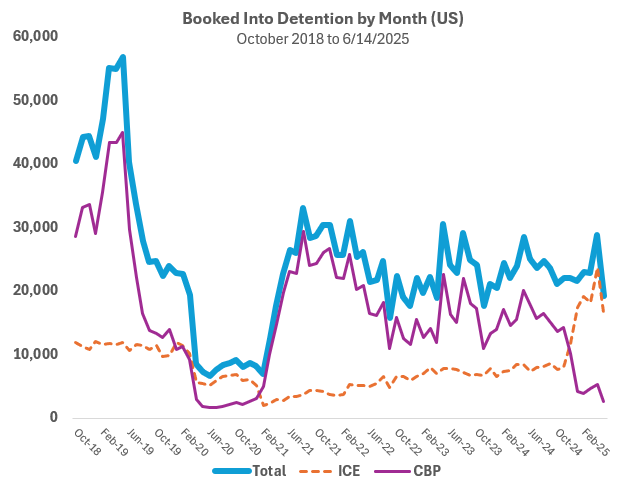
Perhaps surprisingly given the news headlines, the number of people booked into detention by month has remained relatively steady under the current Trump administration and, as of May 2025, remains significantly below the administration's 2018 and 2019 levels. For example, the average monthly bookings (arrests) under the Trump administration of 23,088 is 835 people fewer than under the Biden administration over the same period last year.
However, the stability in overall numbers masks a major operational shift that reveals changing enforcement priorities.
2. The Agency Shift: Interior vs. Border Enforcement
This operational shift becomes clear when examining which agency is conducting the bookings—and what this reveals about enforcement strategy. ICE now accounts for 70% of bookings compared to 30% a year ago under the Biden Administration.
Bookings are increasingly coming from interior enforcement (Immigration and Customs Enforcement - ICE) rather than border apprehensions (Customs and Border Protection - CBP), representing a fundamental shift from the traditional pattern where most arrests occurred at the border itself.
This shift reflects broader border security changes. Due to tightened border security and related deterrent actions under the Trump administration, the number of people attempting to enter California illegally has dropped 84% this year compared to 2024. Monthly average encounters with CBP have fallen dramatically from 246,792 to 39,531.

The Element of Surprise: ICE interior arrests operate differently than border apprehensions, involving strategic timing and location targeting. While interior enforcement traditionally targets individuals during routine activities—at workplaces, during traffic stops, or at residences—the SF Bay Area has seen a significant shift in 2025.
Agents are increasingly targeting sensitive locations like ICE field offices and immigration courts, arresting individuals who attend routine appointments after previous protective policies were rescinded. This allows enforcement even when individuals are complying with legal processes, adding to the climate of uncertainty for undocumented immigrants.
Recent examples include:
Over 15 people, including children, were detained at the San Francisco Immigration Court on June 5
4 arrests at the Concord Immigration Court on June 10
As a result, although the overall level of detention bookings has remained stable, the level of fear and media coverage around these arrests has skyrocketed.
3. Detention Data: Who Gets Held and Where
Once individuals are booked into detention—civil incarceration for immigration purposes—they enter a system with significant geographic variation in both capacity and policies.
Criminal History: As of June 15, 28% of detainees have criminal records with 72% having no convicted criminal issues beyond alleged illegal residence in the US.
Geographic Distribution: While California has the largest undocumented population in the nation, most detainees are actually located in Texas, followed by Louisiana, with California ranking third.

This suggests that enforcement intensity varies significantly by region and that people arrested in California may be transferred to detention facilities outside of the state.
Alternative Detention: While California houses a relatively low number of detainees, it leads the nation in alternative detention options, allowing some individuals to remain in communities while their cases proceed rather than being held in detention facilities. It does so primarily through the SmartLINK smartphone application that migrants use to check in with the government using facial recognition technology.
San Francisco is the nation's leading ICE office in leveraging alternative detention options, currently monitoring 20,397 individuals, representing 11% of the total number of immigrants in alternative detention nationwide.
Once individuals are detained—whether in traditional facilities or alternative programs—they must navigate the immigration court system.
4. The Court Backlog: A System Under Strain
Perhaps the most revealing aspect of current enforcement is the massive backlog in immigration courts, which creates prolonged uncertainty for everyone in the system.
National Backlog: There are currently 3,546,863 active cases in the U.S. Immigration Court backlog, with 382,245 cases in California alone. This court backlog has increased nearly 500% from 2012 to 2025.
Bay Area Impact: The local court system faces substantial pressure with 123,547 cases in San Francisco and 62,259 in Concord.

Case Outcomes: Through May 2025,nationally, judges have ordered deportation in 53% of all immigration cases, while 47% have been allowed to remain in the United States.
Daily Deportations: The US averaged 742 deportations per day in 2024, falling to 661 under President Trump. This pace means that fewer than 2% of the nation's estimated undocumented population would face deportation in any given year
Processing Time Differences: Arrests at the border are processed more quickly since individuals typically haven't established U.S. residence. Interior cases involving established community members require more complex investigations and take much longer to resolve. According to TRAC, California court wait times for individuals fighting deportation averaged 840 days as of 2023.
Conclusion
The nearly 500,000 undocumented immigrants in the Bay Area face a fundamentally different enforcement environment than in previous years. While overall detention numbers remain below peak levels, the shift toward surprise interior enforcement tactics and massive court backlogs create sustained uncertainty for deeply integrated communities.
Current patterns suggest sustained interior enforcement will continue, with the massive court backlog ensuring prolonged uncertainty as the system struggles to process cases. Although the statistical odds of arrest and deportation remain low for undocumented residents (fewer than 2%), the unpredictable nature of enforcement—especially at sensitive locations like courts—creates a climate of fear that affects daily decisions around work, family, and community engagement.
The current system's backlogs and unpredictable enforcement in the Bay Area highlight the need for clearer, more efficient immigration processes that could reduce uncertainty while achieving enforcement goals.