
Counting the Uncounted: Undocumented Immigrants in the Bay Area - Part 1

The Trump administration's renewed focus on border security and deportation efforts has brought illegal immigration back into the national spotlight, with recent riots in Los Angeles highlighting the tensions surrounding this issue. As enforcement intensifies, understanding the reality of undocumented populations becomes critical for residents, policymakers, and community leaders.
The San Francisco Bay Area is home to an estimated 464,435 undocumented immigrants, representing approximately 6% of the region's total population.
This first installment of a two-part series examines their demographics, employment patterns, and geographic distribution. Part two will analyze deportation and enforcement data.
_____________________
Understanding the Data: Important Limitations
The estimates presented here come from the California Immigrant Data Portal, based on U.S. Census data. However, undocumented immigrants are significantly undercounted because many avoid government interaction and lack social security numbers for administrative matching.
What This Means: Our data likely substantially underrepresents the actual population but provides strong indicators of trends and demographic profiles.
_____________________
The Numbers: A Substantial Population
This population of nearly half a million people represents a significant presence in one of America's most economically dynamic regions, comprising over 6% of the Bay Area's total residents.
Geographic Distribution
The undocumented population is not evenly distributed across Bay Area counties. Two counties stand out as primary centers:
Santa Clara County leads with 144,884 undocumented residents, comprising 25% of the region's total undocumented population. It also has the highest concentration, with undocumented immigrants making up over 8% of the county's total population
Alameda County follows closely with 106,037 residents, representing 22% of the total

_____________________
Demographic Profile: A Working-Age Population
Beyond geographic concentration, the demographic characteristics of this population reveal important patterns.
Age Distribution
The age profile of undocumented immigrants shows a population concentrated in prime working years:
60% are between ages 25-44, representing the core working-age demographic
Children (under 18) comprise 8% of the population
Seniors (over 65) represent only 1%, the smallest segment
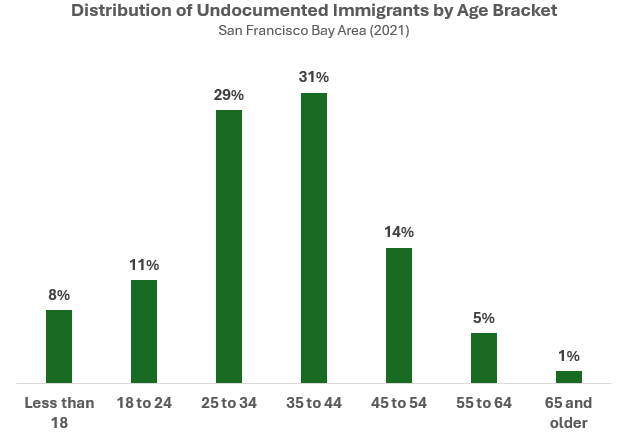
This age distribution suggests economic motivations may drive undocumented immigration, with most being working-age adults seeking employment.
_____________________
Countries of Origin
The origins of Bay Area undocumented immigrants reflect both historical migration patterns and contemporary factors such as economic conditions, family ties, and benefit accessibility:
Mexico remains the largest source at nearly 50% of the population
India contributes 17%
China accounts for 12%, representing the third-largest group
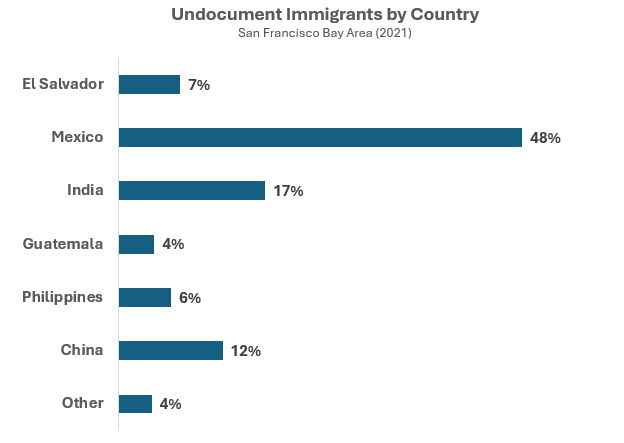
This diversity highlights how the Bay Area's unique economic and social profile attracts illegal immigrants from various regions, not just traditional Latin American sources.
_____________________
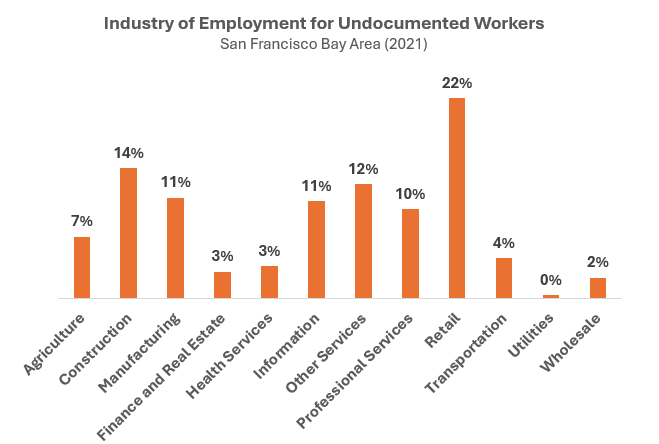
Employment Patterns: Industry Distribution
Undocumented immigrants in the Bay Area work across diverse sectors, with employment concentrated in three main industries:
Top Industries by Employment
Retail (22%): The largest employment sector includes positions such as cleaning, stocking, and sales across the region's retail establishments.
Construction (14%): This sector employs undocumented workers in roles including drywall installers, painters, roofers, and general laborers in the Bay Area's ongoing construction projects.
Other Services (12%): This category encompasses positions such as housekeeping, gardening and maintenance, and elder care throughout the region.
_____________________
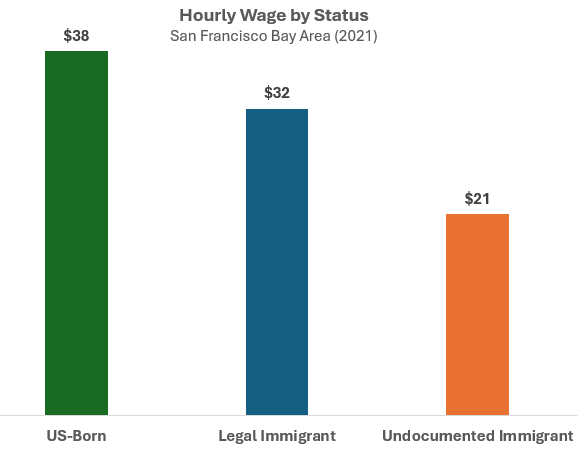
Wage Data
Median hourly wage data reveals significant differences across worker categories, with undocumented workers earning approximately 45% less than US-born workers and about 34% less than legal immigrants.
However, this level is substantially (27%) higher than the state's minimum wage of $16.50.
_____________________
Government Benefits: Access and Limitations
To complete the landscape of undocumented immigrants, it is important to examine what government benefits they can and cannot access, as this topic is highly controversial and represents a clear divide between state and federal policy. California provides one of the most comprehensive benefit packages for undocumented immigrants of any state, including access to driver's licenses.

_____________________
Looking Ahead
As deportation policies intensify, these demographic patterns take on new significance. Nearly half a million people now face an uncertain future in a region where they've become increasingly economically and socially embedded, while receiving support from local and state governments that have been in conflict with federal immigration policies.
Next week, we will examine enforcement data and deportation trends affecting this population and beyond.