
The 266% Surge: Tracking LGBTQ+ Identification Trends

Introduction
In 2012, approximately 8.4 million American adults identified as LGBTQ+. By 2024, that number had grown to over 24 million—comparable to Florida's entire population.
In just over a decade, LGBTQ+ identification has tripled, representing one of the fastest demographic shifts in modern American society.
This article presents data on these significant demographic trends, examining generational differences and regional variations, with a focus on the San Francisco Bay Area, where in some counties more than one in five adults identifies as LGBTQ+.
____________
National Trends: Overview
According to Gallup polling data, the percentage of American adults who identify as LGBTQ+ has shown significant statistical changes over the past decade:
2012 to 2024: LGBTQ+ identification among adults increased from 3.5% to 9.3% of the population, representing a 266% change
Recent Change: In the most recent year, data shows a 22% increase in identification rates
Current Statistics: Approximately one in ten American adults (9.3%) identifies as LGBTQ+

This represents a notable demographic shift in self-reported identity over a relatively short time period.
____________
Generational Analysis
The Gallup data reveals a clear pattern in LGBTQ+ identification across different age cohorts. As shown in the chart below, identification rates decrease consistently with age, with Generation Z showing rates nearly 13 times higher than the Silent Generation.
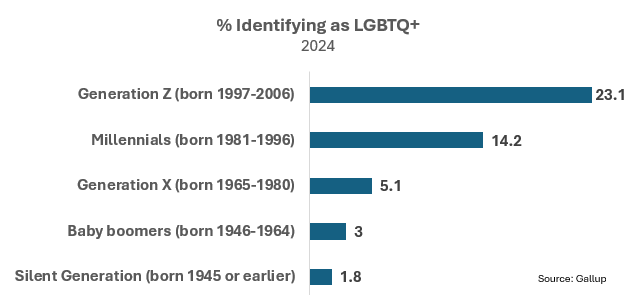
This generational pattern represents one of the most significant findings in the data.
____________
LGBTQ+ Identification Patterns by Type and Gender
The chart below shows the distribution of specific identities within the LGBTQ+ population, with bisexuality representing the majority at 56.3%.
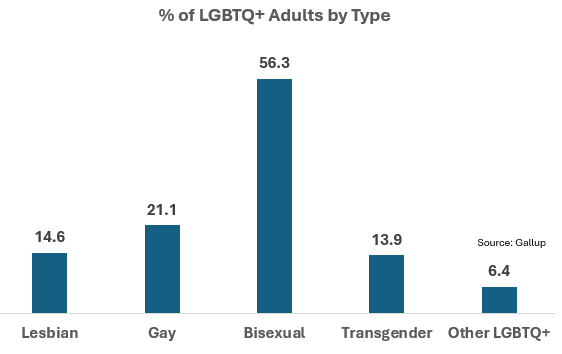
This distribution varies significantly by gender, particularly among younger generations. Gallup's research reveals:
Generation Z: 31% of women versus 12% of men identify as LGBTQ+
Millennials: 18% of women versus 9% of men identify as LGBTQ+
This gender gap is primarily driven by bisexual identification, which is consistently more common among women.
____________
Bay Area Analysis
Data from the California Health Interview Survey provides regional statistics for the San Francisco Bay Area:
Overall Rate: 13% of Bay Area adults identify as LGBTQ+ or questioning, approximately 40% higher than the national average of 9.3%
The data reveals a more than three-fold difference between counties with the highest and lowest LGBTQ+ identification rates:
San Francisco (22.4%) and Sonoma (21.6%) counties both exceed 20% identification rates
Napa and Solano counties show the lowest rates at 6.9% each

____________
Conclusion
The 266% increase in LGBTQ+ identification over just twelve years represents a demographic shift of remarkable speed and scale. The stark generational divide—with Gen Z identifying at rates 13 times higher than the Silent Generation—raises questions about social influences on identity formation. Some researchers have proposed social contagion theories to explain these rapid shifts, while others point to decreased stigma allowing for more authentic self-reporting. Moreover, the threefold difference in identification rates across Bay Area counties, despite their geographic proximity, further suggests that local social environments may significantly influence identification patterns.